
Everyone Will Have Fewer Relatives in the Future
Changing demographics mean shrinking families and more older relatives in future decades
Family structures worldwide are in for a dramatic shift because of a global demographic transition toward lower birth and death rates. In a recent study, researchers estimated that the average 65-year-old woman’s family will decline from 41 relatives in 1950 to 25 in 2095—a drop of nearly two fifths. This reduction is even more pronounced in countries that lack strong institutional support systems, such as Zimbabwe, which is projected to see a 71 percent decrease in family size.
This thinning of family networks is already apparent in China, which is dealing with the consequences of reproduction restrictions, such as the “one-child policy” in effect from 1979 to 2015, among other factors. In 1950 the average Chinese newborn had approximately 11 cousins, but by 2095 that number will decrease to one. And all four of that future newborn’s grandparents will probably be alive at the time of their birth, skewing the average age of their family older.
These changes in family structure could put unprecedented pressure on caregivers of both children and older adults, says lead study author Diego Alburez-Gutierrez, a social scientist at the Max Planck Institute for Demographic Research in Rostock, Germany. Societies have been built around the expectation that supportive family networks will always exist, he says, “but that is going to change in the near future.”
On supporting science journalism
If you’re enjoying this article, consider supporting our award-winning journalism by subscribing. By purchasing a subscription you are helping to ensure the future of impactful stories about the discoveries and ideas shaping our world today.
Families around the World Are Getting Smaller
Past and present family sizes reflect substantial variations by country, but a look toward 2100 shows that the overall trend of shrinking networks is virtually universal.

Amanda Montañez; Source: “Projections of Human Kinship for All Countries,” by Diego Alburez-Gutierrez et al., in Proceedings of the National Academy of Sciences USA, Vol. 120, No. 52; December 19, 2023 (data)
The Size and Composition of a Person’s Family Changes throughout Their Life
Looking at family composition from the perspective of different age groups reveals the significance of the impending changes for caretaking of both young and old people.

Amanda Montañez; Source: “Projections of Human Kinship for All Countries,” by Diego Alburez-Gutierrez et al., in Proceedings of the National Academy of Sciences USA, Vol. 120, No. 52; December 19, 2023 (data)
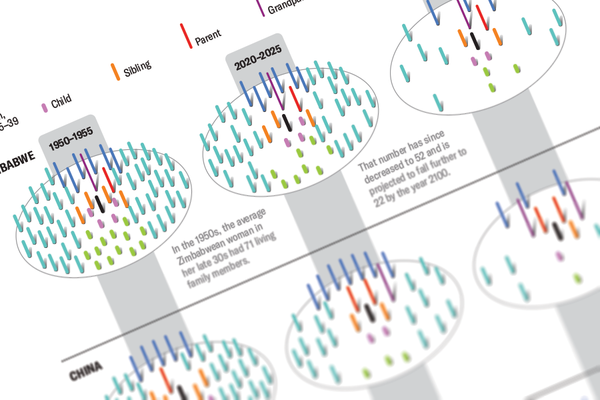
What Past, Present and Future Families Look Like, by Country
The following values reflect the perspective of a woman, age 35–39.

Amanda Montañez; Source: “Projections of Human Kinship for All Countries,” by Diego Alburez-Gutierrez et al., in Proceedings of the National Academy of Sciences USA, Vol. 120, No. 52; December 19, 2023 (data)